US Tipping Statistics: How Much and How Often Americans Tip
Dinner gets tipped far more often than takeout
In Bankrate’s 2025 survey, 70% of sit-down restaurant users said they always tipped, compared with 52% of food-delivery users and 12% of takeout-pickup users. That is a 58-point gap between dinner and pickup. Each percentage describes users of that service, so the survey does not tell us whether the same person tipped differently on two meals.
Outside food, 54% of haircut users and 43% of rideshare users always tipped; among home-repair users, just 9% did. These US tipping statistics track the habit, not the size of the tip. They also show why the work alone does not settle the expectation: home repair can be demanding, yet routine tipping there is rare.
Pickup is common; tipping every time is not
47% of adults picked up takeout at least weekly in 2025, according to the National Restaurant Association. Its definition includes restaurants, coffee shops, snack places and delis. Drive-thru use was nearly as common at 42% weekly; delivery reached 37%. Pickup is frequent, but Bankrate found that only 12% of pickup users always tip. The two studies count different groups, so those percentages cannot be multiplied into a national total of tipped orders.
Coffee-shop tipping varies widely
Bankrate’s 18% coffee figure means “always,” not “ever.” In Pew’s 2023 response table, 25% of coffee-shop users said they always or often tipped, 27% sometimes tipped, 23% rarely did and 25% never did. The surveys ask different questions, but both show habitual coffee tipping was a minority behavior. The coffee barista tipping guide covers what to do at the counter.
Tipping fell, recovered—and kept falling at coffee shops
“Are Americans tipping less?” depends on the starting year. Among sit-down restaurant users, the share who always tipped fell from 75% in 2021 to 65% in 2023, then recovered to 70% in 2025. It was up five points from the low, but still five points below 2021. That is a narrower and more useful finding than a blanket claim that Americans have stopped tipping.

| Service | 2021 | 2022 | 2023 | 2024 | 2025 |
|---|---|---|---|---|---|
| Sit-down restaurants | 75% | 73% | 65% | 67% | 70% |
| Food delivery | 59% | 57% | 50% | 51% | 52% |
| Coffee baristas | 23% | 22% | 22% | 20% | 18% |
| Hair stylists/barbers | 63% | 66% | 53% | 55% | 54% |
Food delivery followed the restaurant dip, from 59% in 2021 to 50% in 2023, then 52% in 2025. Coffee was different: its “always tip” share slid from 23% to 18% without a single annual increase in the published series. Haircuts ended nine points below 2021, at 54%.
These are frequencies, not dollars. A customer who changes from tipping $1 on every coffee to $1 on half their visits leaves the “always” group, but the survey cannot calculate their monthly spending. The tip calendar can track an individual’s actual tips. To see what people leave on restaurant bills, we need payment records.
Restaurant tip rates barely moved across nine quarters
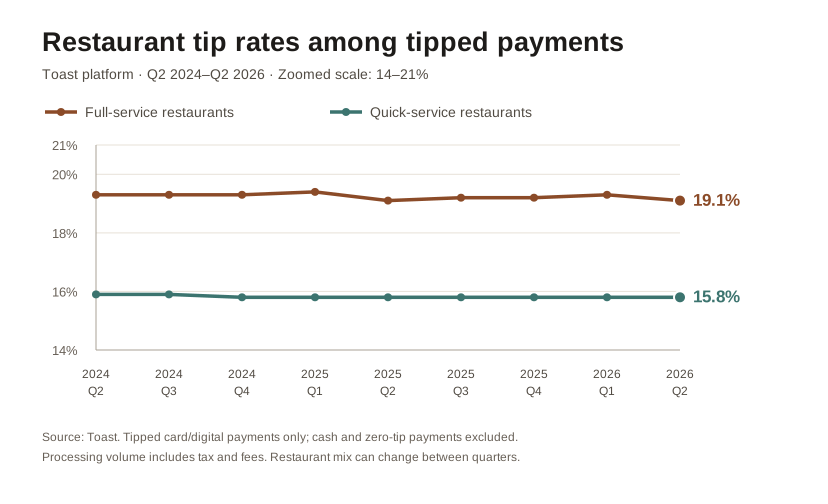
Bankrate measured how often people tip; Toast measured the tip value on eligible card and digital payments that included a tip. In Q2 2026, Toast’s average tip percentage was 19.1% at full-service restaurants and 15.8% at quick-service restaurants. Those are rates on selected payments, not the percentage of diners who left a tip.
View the quarterly data table
| Quarter | Full service | Quick service |
|---|---|---|
| 2024 Q2 | 19.3% | 15.9% |
| 2024 Q3 | 19.3% | 15.9% |
| 2024 Q4 | 19.3% | 15.8% |
| 2025 Q1 | 19.4% | 15.8% |
| 2025 Q2 | 19.1% | 15.8% |
| 2025 Q3 | 19.2% | 15.8% |
| 2025 Q4 | 19.2% | 15.8% |
| 2026 Q1 | 19.3% | 15.8% |
| 2026 Q2 | 19.1% | 15.8% |
Across nine quarters, the full-service rate stayed within 19.1%–19.4%; quick service stayed within 15.8%–15.9%. On a $100 calculation base, the full-service range is only 30 cents, while the Q2 2026 gap between the two restaurant types is $3.30. Use the tip calculator to apply a percentage to your own bill; these platform averages describe past payments, not a required rate.
What the 19.1% leaves out
Cash and eligible payments with no tip are excluded. Toast also includes taxes and fees in its calculation base, and the mix of restaurants on its platform can change. The 19.1% figure therefore describes tipped Toast payments, not all US restaurant bills.
In a hypothetical set of ten $20 bills, five $4 tips and five zero tips produce a 20% rate among tipped bills, but a 10% rate across all ten. The customers and payments are identical; the included bills change.
In a different measure, Pew’s 2023 survey asked about a hypothetical meal with average food and service. Of all respondents, 57% said they would leave 15% or less, including 2% who would leave nothing; 25% chose 20% or more. Pew recorded intended behavior, while Toast counted tipped payments. That difference matters more than a small gap between two headline percentages.
State rates do not describe residents
Toast’s Q2 2026 overall restaurant rate was 21.4% in Delaware and 17.1% in California, a 4.3-point difference. At full-service restaurants the rates were 21.8% and 17.6%. The state table covers payments at participating restaurants, including visitors’ purchases; it does not measure how generously state residents tip everywhere they go.
For a real meal, the restaurant tipping guide explains customary ranges and when the bill’s service charge changes the decision. The observed rates above are context for that choice.
Delivery and rideshare tips are measured per trip
Outside restaurants, reports often switch from percentages to dollars per trip. Gridwise put the average delivery tip at $4.16 per trip in Q4 2025, down 0.7% year over year. Its rideshare figure reached a reported record of $1.58 per trip. The two services moved in opposite directions in the same report. Gridwise published the figures in its 2026 release.
The 0.7% decline is about three cents per delivery trip. Gridwise does not present $4.16 as a DoorDash-only average, and its public summary does not fully explain how zero-tip trips or trip weights enter either figure. The per-trip dollars cannot be compared with Toast’s restaurant percentages without the underlying bills. They also cannot tell us how many customers tipped at all.
The fee on a receipt is not the driver’s tip
The checkout total creates another easy mix-up. DoorDash separates its delivery and service fees from the voluntary Dasher tip and says the tip goes to the Dasher. If a receipt includes a $6 delivery fee, that $6 is not automatically a $6 tip; the tip line is the amount to check. DoorDash explains the fee breakdown.
The DoorDash and Uber tipping guides address a particular order or ride. Uber says tipping is optional. A platform-wide average is useful evidence of behavior, not a suggested amount for the next trip.
A tip screen can irritate someone who still tips
“Tip fatigue” describes frustration, not a count of people who stopped tipping. In Bankrate’s 2025 survey, 63% of adults held at least one negative view of tipping. Two complaints each drew 41%: employers relying too heavily on tips to pay staff, and tipping culture feeling out of control. Another 38% disliked screens with pre-entered amounts. Respondents could select more than one complaint. Bankrate’s findings include the questions.
Pew’s 2023 survey helps explain why the request itself can feel awkward: 72% said tipping was expected in more places than five years earlier, yet only 34% found it very or extremely easy to know whether to tip and 33% found it that easy to know how much. Asked whether tipping was a choice or an obligation, the largest group—49%—answered “it depends.” Pew’s results describe uncertain expectations, not the end of tipping. “It depends” also fits the service-by-service divide: a person can have a settled rule for dinner and no settled rule for pickup.
Some respondents said the screen changed what they left: 27% told Bankrate they tipped less or nothing when shown a pre-entered amount, while 11% said they tipped more. These are reports about their own behavior. The survey did not observe checkouts or establish that the screen caused the change.
Frequent tippers can also be critics
Age groups make that tension harder to ignore. Among 2025 sit-down restaurant users, 43% of Gen Z said they always tipped, versus 84% of baby boomers. Yet among all adults in those age groups, 57% of Gen Z and 68% of boomers held a negative view of tipping. Those are different survey denominators, but the broad contrast matters: the group more likely to tip routinely was also more likely to criticize the system. Bankrate’s age-group findings include the definitions and questions.
Service quality was a major tipping factor for 77% of adults in Pew’s 2023 survey.
Only 5% said quality played no role. Pew’s decision-factor results also found that social pressure and the cost of the tip were each major factors for about a quarter of adults. A screen can add pressure, but the survey does not reduce every tipping decision to that prompt.
Common questions about US tipping statistics
What is the average tip percentage in the US?
There is no single comparable rate across every service in these sources. For Q2 2026, Toast reported 19.1% at full-service restaurants and 15.8% at quick-service restaurants on eligible tipped card and digital payments. Cash and zero-tip payments are outside those rates.
Are Americans tipping less than before?
There is no all-service yes or no. Bankrate’s restaurant “always tip” share rose from 65% in 2023 to 70% in 2025 but remained below 2021’s 75%. Coffee’s share fell from 23% in 2021 to 18% in 2025.
What is the average delivery tip?
Gridwise reported $4.16 per delivery trip in Q4 2025 in its dataset. That is a trip average, not a recommended amount or a DoorDash-only figure. Its public summary does not completely specify how it handles trips without tips.
Sources and methods
This article draws on published surveys and payment reports. Dates below refer to the underlying research periods; the figures are not all observations from the same year.
- Bankrate / YouGov, annual series and 2025 survey: online survey of 2,277 US adults, April 23–25. Nonprobability sample with demographic quotas and weighting. The 2021–2025 table reproduces Bankrate’s published series. Service percentages cover users of each service; age bands refer to 2025.
- Toast, Q2 2024–Q2 2026: quarterly restaurant payments and Q2 2026 state rates from a changing platform sample. Both the chart and table include Q2 2026. Eligible tipped card/digital payments only; cash tips and untipped payments excluded. The processing base includes taxes and fees.
- Gridwise, 2026 report release: delivery and rideshare tips per trip, with the delivery figure identified as Q4 2025. The public summary leaves zero-tip treatment and aggregation weights partly unspecified.
- Pew Research Center, 2023: survey of 11,945 US adults, August 7–27, covering frequency, expectations, decision factors and a hypothetical restaurant meal. Combined response percentages use Pew’s published aggregates; rounded components may not sum exactly. The data are separate from Bankrate’s annual series.
- National Restaurant Association, 2025: public Off-Premises Restaurant Trends findings on weekly takeout, drive-thru and delivery use. Usage groups overlap; these figures do not measure tipped transactions.
Dollar examples labeled hypothetical or illustrative are calculations for this article, not additional survey findings.